As a YouTube streamer, do you want to understand how your live streams are performing? If so, read this post on MiniTool Video Converter for a complete guide on YouTube live stream analytics.
Live streaming on YouTube has become an essential way for creators, brands, educators, and influencers to engage with their audiences in real time. But to grow and succeed as a live streamer, it’s not enough to just go live; you need to understand how your live streams are performing.
In this post, we’ll explore what YouTube live analytics are, how to access them, and what each metric means. Understanding them can help you measure your live stream performance, and further increase your viewers and grow your channel.
What Is YouTube Live Stream Analytics
YouTube live stream analytics are performance metrics that YouTube provides for any live broadcast on the platform. These analytics are accessible in YouTube Studio and provide real-time insights during the stream, as well as post-stream analysis after the event ends. They include viewer behavior, engagement rates, stream health, chat activity, and much more.
Understanding these analytics helps you:
- Evaluate audience engagement
- Determine which content segments worked best
- Optimize future live broadcasts
Whether you’re new to live streaming or a seasoned content creator, these metrics give you a behind-the-scenes look at how your live events resonate with your audience.
How to Access YouTube Live Stream Analytics
How can you access your live stream analytics on YouTube? YouTube offers live stream analytics in two primary stages: during the stream and after the stream ends.
1. During the Live Stream (Real-Time Monitoring)
While you’re live streaming, you can access analytics via the Live Control Room in YouTube Studio. This dashboard provides real-time updates about viewer activity and stream health. Here’s how to see YouTube live stream analytics during the stream:
1. Go to YouTube and navigate to your YouTube Studio.
2. Click on Go live to start a new live stream.
3. Enter the Live Control Room.
4. Then, you can monitor key metrics under the Analytics and Stream Health tabs.
2. After the Stream Ends (Post-Event Analysis)
Once the stream ends, you can access full analytics through your regular YouTube dashboard. Here’s how to find them:
1. Visit YouTube, click on your profile picture, and choose YouTube Studio.
2. Click the Content tab on the left side and select the Live section.
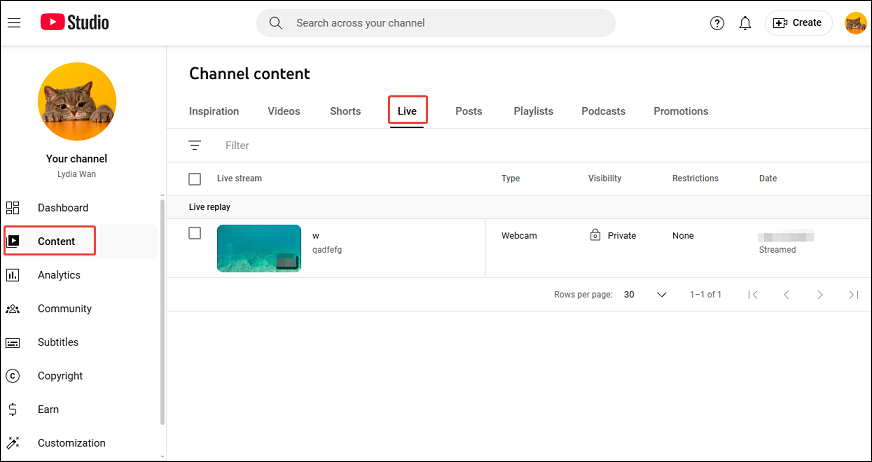
3. Click on the title of your stream.
4. Navigate to the Analytics tab.
This tab shows you deeper insights about your live streams, such as revenue, average view duration, audience retention, and traffic sources.
Key YouTube Live Analytics Metrics Explained
After accessing your YouTube live analytics, you may find some metrics confusing. Here’s a breakdown of the most important metrics and why they matter:
#1. Concurrent Viewers
This is the number of people watching your stream at a specific moment. It updates in real-time during the stream.
Why it matters: It shows when your audience is most engaged. Use this to identify what parts of your stream hold your viewers’ attention best.
#2. Peak Concurrent Viewers
The highest number of viewers that watched simultaneously during your stream.
Why it matters: It allows you to understand your stream’s maximum reach quickly. You can check when the peaks occurred and analyze the situation at that time.
#3. Playbacks
The total number of times the stream was started playing, including replays.
Why it matters: Playbacks include viewers who may have dropped off and returned, giving a broader picture of your reach.
#4. Unique Viewers
An estimate of how many individual users watched your stream.
Why it matters: This can help you understand how many different people you reached. A stream might have 100 peak viewers, but over time, it might reach 1,000 unique viewers, indicating that many people are viewing briefly.
#5. Average View Duration
The average amount of time viewers spent watching your live stream.
Why it matters: This is a measure of your stream’s ability to hold attention. A low average view duration could indicate unengaging content.

#6. Chat Rate
The number of chat messages posted per minute.
Why it matters: Chat rate is a direct measure of audience engagement. A high chat rate often coincides with exciting or engaging moments.
#7. Likes and Dislikes
The total number of users who have liked/disliked the stream.
Why it matters: These engagement metrics can influence how YouTube recommends your content. A highly liked stream may be promoted more widely on the platform.
#8. New Subscriber
The number of people who subscribed to your channel during the live stream.
Why it matters: This indicates how effective your content and CTAs (calls-to-action) were. If certain streams bring in more subscribers, they may be more aligned with your viewers’ interests.
#9. Stream Health
This is a technical metric shown during the broadcast that monitors internet stability, bitrate, dropped frames, resolution, encoder performance, etc.
Why it matters: It ensures you’re delivering a smooth experience for viewers. Poor stream health can cause buffering and cause people to leave.
MiniTool Video ConverterClick to Download100%Clean & Safe
Final Thoughts
If you’re a streamer on YouTube, it’s crucial to monitor your YouTube live stream analytics. It helps you track your stream’s performance and improve your future streams. This post has shown how to view your live analytics step by step and explained some key metrics.